- Overview
- Documents
- Demos
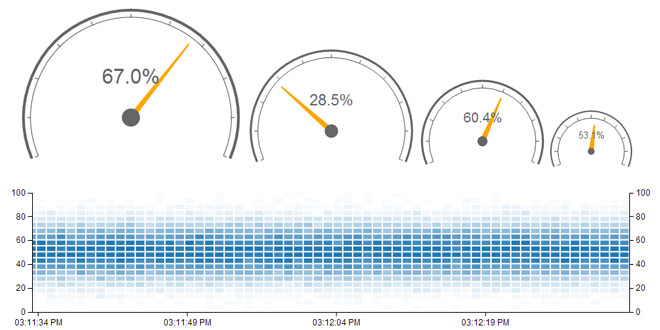
Epoch is a general purpose charting library for application developers and visualization designers. It focuses on two different aspects of visualization programming: basic charts for creating historical reports, and real-time charts for displaying frequently updating timeseries data.
Source: fastly.github.io
1. INCLUDE CSS AND JS FILES
<link rel="stylesheet" type="text/css" href="css/epoch.X.Y.Z.min.css">
<script src="js/jquery.min.js"></script>
<script src="js/d3.min.js"></script>
<script src="js/epoch.X.Y.Z.min.js"></script>
2. HTML
<div id="area" class="epoch category10" style="height: 200px;"></div>
Epoch will automatically size the chart to fit the explicit dimensions of the container. This way you can build the basic layout of your site and use CSS to control the size and placement of the charts. The class name category10 refers to the categorical color scheme to use when rendering the chart. There are three other default options you can use, namely: category20, category20b, and category20c. Categorical colors are based directly on those used by d3, for more information see the d3 categorical color docs.
3. JAVASCRIPT
var data = [
  { label: 'Layer 1', values: [ {x: 0, y: 0}, {x: 1, y: 1}, {x: 2, y: 2} ] },
  { label: 'Layer 2', values: [ {x: 0, y: 0}, {x: 1, y: 1}, {x: 2, y: 4} ] }
];
ar areaChartInstance = $('#area').epoch({ type: 'area', data: data });
4. OPTIONS
Unless otherwise stated each of the charts below have the following common options:
| Name | Description |
|---|---|
| axes |
Which axes to display. Example: axes: ['top', 'right', 'bottom', 'left'] |
| ticks |
Number of ticks to display on each axis. Example: { top: 10, right: 5, bottom: 20, left: 5 } |
| tickFormats |
What formatting function to use when displaying tick labels. Example: tickFormats: { bottom: function(d) { return '$' + d.toFixed(2); } } |
| margins |
Explicit margin overrides for the chart. Example: margins: { top: 50, right: 30, bottom: 100, left: 40 } |
| width |
Override automatic width with an explicit pixel value. Example: width: 320 |
| height |
Override automatic height with an explicit pixel value. Example: height: 240 |
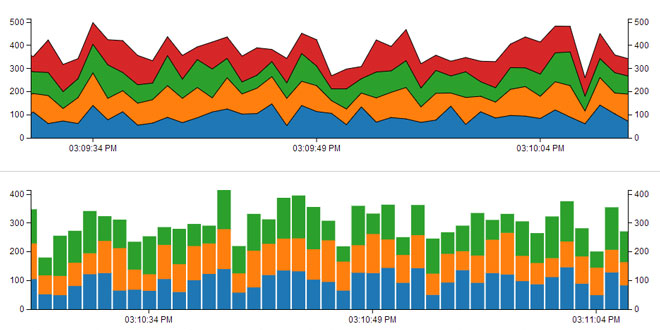
5. AREA CHART
var areaChartData = [
  // The first layer
  {
    label: "Layer 1",
    values: [ {x: 0, y: 100}, {x: 20, y: 1000}, ... ]
  },

  // The second layer
  {
    label: "Layer 2",
    values: [ {x: 0, y: 78}, {x: 20, y: 98}, ... ]
  },

  // Add as many layers as you would like!
];
As you can see the data is arranged as an array of layers. Each layer is an object that has the following properties:
- label - The name of the layer
- values - An array of values (each value having an x and y coordinate)
For the best results each layer should contain the same number of values, with the same x coordinates. This will allow d3 to make the best looking graphs possible. To create a single series plot simply include a single layer.
Given that you have data in the appropriate format, instantiating a new chart is fairly easy. Simply create a container element in HTML and use the jQuery bindings to create, place, and draw the chart:
<div id="areaChart" style="width: 800px; height: 200px"></div>
<script>
  $('#areaChart').epoch({
    type: 'area',
    data: areaChartData
  });
</script>
6. BAR CHART
Epoch's implementation of a multi-series grouped bar chart. Bar charts are useful for showing data by group over a discrete domain. First, let's look at how the data is formatted for a bar chart:
var barChartData = [
  // First bar series
  {
    label: 'Series 1',
    values: [
      { x: 'A', y: 30 },
      { x: 'B', y: 10 },
      { x: 'C', y: 12 },
      ...
    ]
  },

  // Second series
  {
    label: 'Series 2',
    values: [
      { x: 'A', y: 20 },
      { x: 'B', y: 39 },
      { x: 'C', y: 8 },
      ...
    ]
  },

  ... // Add as many series as you'd like
];
The bar chart will create groups of bars that share a like x value for each independent value present in the values array. Currently only grouped bar charts are available but we're planning on adding stacked and normalized stacked charts soon!
Next, let's take a look at the markup and scripting required to display our bar data:
<div id="barChart" style="width: 300px; height: 100px"></div>
<script>
  $('#barChart').epoch({
    type: 'bar',
    data: barChartData
  });
</script>
Options
The bar chart has the following set of additional options:
| Name | Description |
|---|---|
| orientation |
Sets the orientation for the chart. Can be either 'horizontal' (default), or 'vertical'. Example: orientation: 'vertical' |
7. LINE CHART
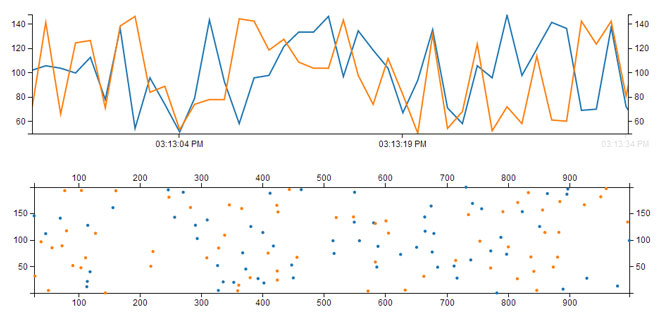
Line charts are helpful for visualizing single or multi-series data when without stacking or shading. To begin, let's take a look at the data format used by epoch's line chart:
var lineChartData = [
  // The first series
  {
    label: "Series 1",
    values: [ {x: 0, y: 100}, {x: 20, y: 1000}, ... ]
  },

  // The second series
  {
    label: "Series 2",
    values: [ {x: 20, y: 78}, {x: 30, y: 98}, ... ]
  },

  ...
];
Notice that the data is very similar to that of the area chart above, with the exception that they need not cover the same domain nor do the entries in each series have to line up via the x coordinate.
Next let's take a look at how you would implement the chart with markup and scripting:
<div id="lineChart" style="width: 700px; height: 250px"></div>
<script>
  $('#lineChart').epoch({
    type: 'line',
    data: lineChartData
  });
</script>
8. PIE CHART
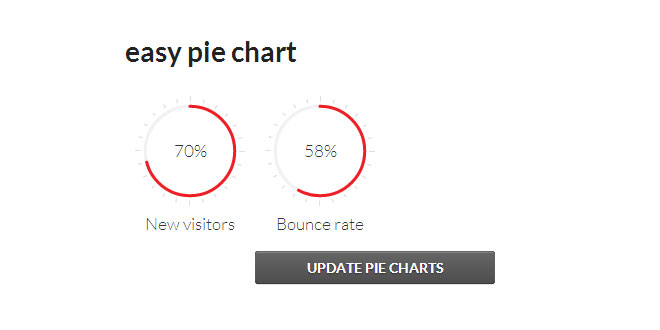
Pie charts are useful for displaying the relative sizes of various data points. To begin, let's take a look at the data format used by Epoch's pie chart implementation:
var pieData = [
  { label: 'Slice 1', value: 10 },
  { label: 'Slice 2', value: 20 },
  { label: 'Slice 3', value: 40 },
  { label: 'Slice 4', value: 30 }
]
The data itself is an array of objects that represent the slices in the pie chart. The label parameter will be used to set the label for the slice in the chart and the value parameter will be used to determine its visual size in comparison to the other slices.
Once you have your data formatted correctly you can easly add a chart to your page using the following markup and script:
<div id="pie" style="width: 400px; height: 400px"></div>
<script>
  $('#pie').epoch({
    type: 'pie',
    data: pieData
  });
</script>
Options
The pie chart is the only basic chart that does not accept all of the common options. Here is the complete list of options one can use when initializing a pie chart:
| Name | Description |
|---|---|
| margin |
Surrounds the chart with a defined pixel margin. Example: margin: 30 |
| inner |
Inner radius for the pie chart (for making Donut charts). Example: inner: 100 |
| width |
Override automatic width with an explicit pixel value. Example: width: 320 |
| height |
Override automatic height with an explicit pixel value. Example: height: 240 |
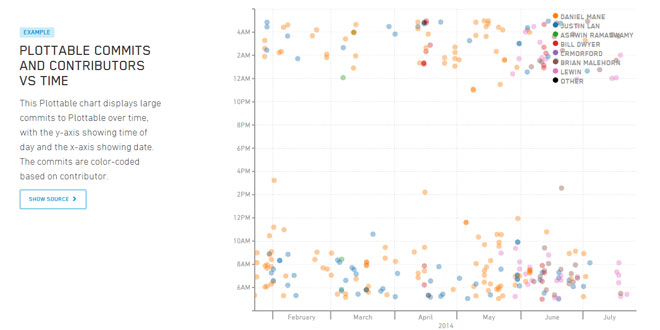
9. SCATTER
Scatter plots are useful for visualizing statistical or sampling data in hopes of revealing patterns. To begin let's take a look at the data format used by scatter plots:
var scatterData = [
  // The first group
  {
    label: "Group 1",
    values: [ {x: 5, y: 100}, {x: 93, y: 1424}, ... ]
  },

  // The second group
  {
    label: "Group 2",
    values: [ {x: -52, y: 78}, {x: 120, y: 17}, ... ]
  },

  ...
];
The data is composed of an array containing "groups" of points. Groups need not have the same number of values nor do they have to match the same x coordinate domains.
Next, let's see the markup and scripting needed to add the plot to your page:
<div id="scatter" style="width: 500px; height: 500px"></div>
<script>
  $('#scatter').epoch({
    type: 'scatter',
    data: scatterData
  });
</script>
Options
| Name | Description |
|---|---|
| radius |
How large the "dots" should be in the plot (in pixels). Example: radius: 4.5 |
More information about Real-time charts at: http://fastly.github.io/epoch/real-time/
 JS Tutorial
