Download
User Rating: 3.4/5 ( 1 votes)
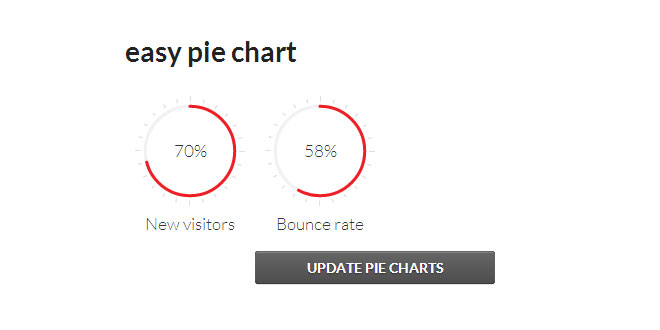
Easy pie chart is a jQuery plugin that uses the canvas element to render simple pie charts for single values. These charts are highly customizable, very easy to implement, scale to the resolution of the display of the client to provide sharp charts even on retina displays, and use requestAnimationFrame for smooth animations on modern devices.
Browser support
This plugin supports all major browsers that support the canvas element. With excanvas you can even render the charts on IE 7+8.
Source: rendro.github.io
1. INCLUDE JS AND CSS FILES
<script type="text/javascript" src="https://ajax.googleapis.com/ajax/libs/jquery/1.7.2/jquery.min.js"></script>
<script type="text/javascript" src="/path/to/jquery.easy-pie-chart.js"></script>

<link rel="stylesheet"type="text/css" href="/path/to/jquery.easy-pie-chart.css">
2. HTML
Add a element to your site to represent chart and add the data-percent attribute with the percent number the pie chart should have:
<div class="chart" data-percent="73">73%</div>
3. JAVASCRIPT
$(function() {
    $('.chart').easyPieChart({
        //your configuration goes here
    });
});
4. OPTIONS
You can pass a set of these options to the initialize function to set a custom behaviour and look for the plugin.
|
Property (Type) |
Default |
Description |
|
barColor |
#ef1e25 |
The color of the curcular bar. You can pass either a css valid color string like rgb, rgba hex or string colors. But you can also pass a function that accepts the current percentage as a value to return a dynamically generated color. |
|
trackColor |
#f2f2f2 |
The color of the track for the bar, false to disable rendering. |
|
scaleColor |
#dfe0e0 |
The color of the scale lines, false to disable rendering. |
|
lineCap |
round |
Defines how the ending of the bar line looks like. Possible values are: butt, round and square. |
|
lineWidth |
3 |
Width of the bar line in px. |
|
size |
110 |
Size of the pie chart in px. It will always be a square. |
|
animate |
false |
Time in milliseconds for a eased animation of the bar growing, or false to deactivate. |
|
onStart |
$.noop |
Callback function that is called at the start of any animation (only if animate is not false). |
|
onStop |
$.noop |
Callback function that is called at the end of any animation (only if animate is not false). |
|
onStep |
$.noop |
Callback function that is called during animations providing the current value (the context is the plugin, so you can access the DOM element via this.$el). |
5. API
If you want to update the current percentage of the a pie chart, you can call theupdate method. The instance of the plugin is saved in the jQuery-data.
<script type="text/javascript">
$(function() {
    //create instance
    $('.chart').easyPieChart({
        animate: 2000
    });
    //update instance after 5 sec
    setTimeout(function() {
        $('.chart').data('easyPieChart').update(40);
    }, 5000);
});
</script>
 JS Tutorial


