Download
User Rating: 2.9/5 ( 3 votes)
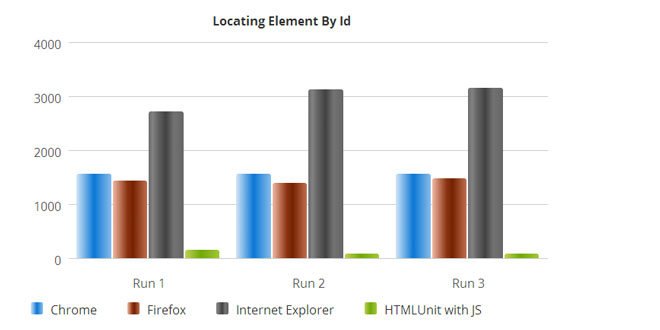
A very simple jQuery plugin to render bar chart from existing HTML tables.
-
Easy to use (no extra javascript code to define data).
-
Animation (at display time and hovering on legend item)
-
Popup for value of each bar
-
Support group by table column (default) or table row
-
Tested on IE, Firefox, Chrome.
1. INCLUDE STYLESHEET AND JAVASCRIPT
<link rel="stylesheet" href="TableBarChart.css" />
<script type="text/javascript" src="jquery-1.11.0.min.js"></script>
<script type="text/javascript" src="TableBarChart.js"></script>
2. HTML
<table id="source">
    <caption>Your Chart Title</caption> <!-- optional -->
    <thead>               <!-- Must have -->
        <tr>
            <th></th>       <!-- Must have an empty <th> here -->
            <th>Column Title 1</th> <!-- Must have -->
            ...
        </tr>
    </thead>
    <tbody>                   <!-- Must have -->
        <tr>
            <th>Row Title 1</th>    <!-- First cell of each row must be <th> -->
            <td>value 1</td>    <!-- Data cell must be <td> -->
            ....
        <tr>
        ...             <!-- Repeat above pattern -->
    </tbody>
</table>
<div id="target" style="width: 600px; height: 400px">
</div>
3. JAVASCRIPT
<script type="text/javascript">
    $(function() {
        $('#source').tableBarChart('#target', '', false);
    });
</script>
#source is id of your <table>. #target is id of your desire <div> to hold the bar chart. Second argument is your overwritten title of chart. Third argument to reverse the grouping mechanism: true means group by row, false means group by columns (default behavior).
 JS Tutorial


