Download
Demo
- Overview
- Documents
User Rating: 0/5 ( 0 votes)
Your Rating:
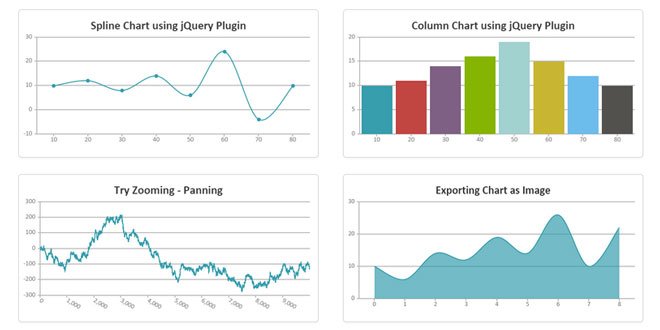
Graph is a jQuery plugin for creating of graph using of coordinates using specific input array
sex shop sex shop sex shop sex shop sex shop seks shop spanish fly psikolog sohbet numara sohbet hatti
Source: github.com
1. INCLUDE JS FILES
<script type="text/javascript" src="../bower_components/jquery/dist/jquery.min.js" ></script>
<script type="text/javascript" src="../src/patgod85.graph.js"></script>
2. HTML
<div id="graph-holder"></div>
3. JAVASCRIPT
$('#graph-holder').graph(
            {
                width: 640,
                height: 320
            },
            [
                [0, '', '9 April 2014 21:14', 22000],
                [1, '1', '10 April 2014 07:00', 21000],
                [1, '2', '10 April 2014 12:00', 19800],
                [1, '1', '10 April 2014 12:40', 19700],
                [0, '', '10 April 2014 17:30', 19500],
                [1, '2', '11 April 2014 00:26', 19000],
                [1, '1', '11 April 2014 03:54', 18000]
            ]
);
4. OPTIONS
- width - width of canvas,
- height - height of canvas,
- marginX - margin between canvas right/left border and Y axis,
- marginY - margin between canvas top/bottom border and X axis,
- backgroundColor - color of background,
- axesColor - color of axes,
- axesDescriptionColor - color of axes' descriptions,
- linesColor - color of graph line and square under it,
- stepsX - count of cells on X axis
- stepsY - count of cells on Y axis
- yK - coefficient for Y. If yK == 1 the minimum graph point will be lie on X axis. If if will be 1,5 then minimum point will be about a middle of graph
- debug - force eventListener to put information about mouse position into paragraph under graph,
- types - array of available types
Type can have options:
- color - color of point for this type
- description - description of type that will be shown in agenda
Default options:
{
    width: 1280,
    height: 1024,
    marginX: 50,
    marginY: 50,
    backgroundColor: 'white',
    axesColor: '#DEDEDE',
    axesDescriptionColor: '#979797',
    linesColor: '#D9F1FD',
    stepsX: 8,
    stepsY: 5,
    yK: 1.5,
    debug: false,
    types: [{color: '#39A8EC', description: 'ваша ставка'}, {color: '#0457AB', description: 'другая компания'}]
}
5. DATA FORMAT
Array of array with elements:
- type - ID of type from options.types
- description - will be shown under point on the graph
- datetime - date and time in format that supported by Date.parse. Axis X
- value - value. Axis Y
Example:
[
    [0, '', '9 April 2014 21:14', 22000],
    [1, '1', '10 April 2014 07:00', 21000],
    [1, '2', '10 April 2014 12:00', 19800],
    [1, '1', '10 April 2014 12:40', 19700],
    [0, '', '10 April 2014 17:30', 19500],
    [1, '2', '11 April 2014 00:26', 19000],
    [1, '1', '11 April 2014 03:54', 18000]
]
 JS Tutorial


