- Overview
- Documents
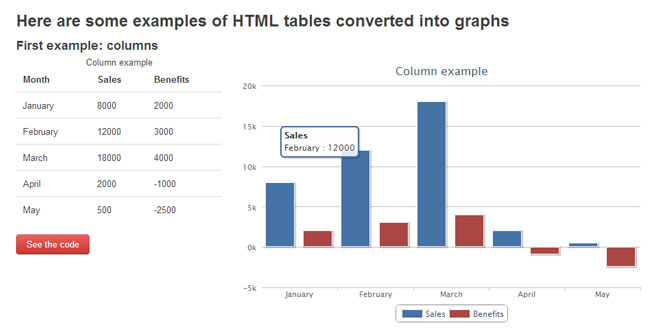
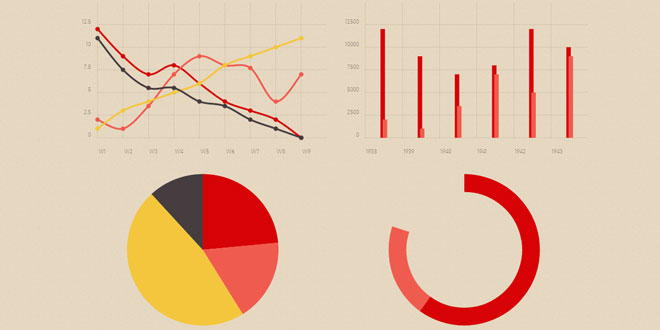
HighchartTable is a jQuery plugin provides you a simple way to convert your HTML data tables into fancy Highcharts graphs?
Source: highcharttable.org
1. INCLUDE CSS AND JS FILES
<script src="jquery.min.js" type="text/javascript"></script>
<script src="highcharts.js" type="text/javascript"></script>
<script src="jquery.highchartTable.js" type="text/javascript"></script>
2. HTML
The series names are defined in the <thead>, their values are defined in the <tbody>.
The first <td> of a <tr> contains the Xaxis value. The other ones contain the values for each series in that x value.
<table class="highchart" data-graph-container-before="1" data-graph-type="column">
  <thead>
      <tr>
          <th>Month</th>
          <th>Sales</th>
      </tr>
   </thead>
   <tbody>
      <tr>
          <td>January</td>
          <td>8000</td>
      </tr>
      <tr>
          <td>February</td>
          <td>12000</td>
      </tr>
  </tbody>
</table>
3. JAVASCRIPT
$(document).ready(function() {
  $('table.highchart').highchartTable();
});
4. GRAPH
3. LEGEND
4. SERIES
5. LINES
6. AXES
7. POINTS
8. VERTICAL LINES
9. PIE CHARTS SPECIFIC OPTIONS
10. DYNAMIC OPTIONS IN JAVASCRIPT
Just before the graph is rendered, an event is triggered, which allows you to change the Highchart chart options.
For example, let's say that you want to define the colors of your data series according to the graph container. Instead of doing this on server-side on every chart you have, you will do this on the client side using the highchartTable.beforeRender jQuery custom event.
11. CHANGES
In issue 8 we removed the default value for the graph-yaxis-X-title-text attribute. If you were using it, here is an example of how you can get the default value back :
Attribute
Scope
Informations
Allowed values
caption
The chart's main title is defined via the table caption.
<table><caption>this is a title</caption></table>
Any string
data-graph-area-fillOpacity
table
Works only on area graphs.
Decimal from 0 to 1
data-graph-container-before
data-graph-container
table
There are two ways to define where the graph must be rendered.
If you want a graph before the table you can use "data-graph-container-before"
otherwise use "data-graph-container" and use a CSS selector to choose where to display the graph.
For data-graph-container-before : 1
For data-graph-container : a CSS selector
data-graph-datalabels-formatter
table
Callback to format the datalabels displayed on the chart.
Name of the function to call
data-graph-height
table
Graph height.
Height in px
data-graph-inverted
table
Inverts the graph axes.
1
data-graph-margin-bottom
table
Graph bottom margin.
Margin in px
data-graph-margin-left
table
Graph left margin.
Margin in px
data-graph-margin-right
table
Graph right margin.
Margin in px
data-graph-margin-top
table
Graph top margin.
Margin in px
data-graph-subtitle-text
table
Graph subtitle.
Any string
data-graph-type
table
The data-graph-type attribute is required.
Attribute
Scope
Informations
Allowed values
data-graph-legend-disabled
table
Disable the legend.
1
data-graph-legend-layout
table
vertical/hortizontal (default : horizontal)
data-graph-legend-width
table
width in px
data-graph-legend-x
table
Legend x offset
offset in px
data-graph-legend-y
table
Legend y offset
offset in px
Attribute
Scope
Informations
Allowed values
data-graph-color-1
table
From data-graph-color-1 to data-graph-color-9. Where the number is the serie index (starting from 1).
hexadecimal color
data-graph-dash-style
th
data-graph-hidden
th
Hide the serie by default. It could be displayed by clicking on the legend.
1
data-graph-skip
th
Ignores the serie.
1
graph-stack-group
th
Allows to display series on the same column by setting the same data-graph-stack-group value for those series.
Any string
Attribute
Scope
Informations
Allowed values
data-graph-line-shadow
table
Area graphs has a shadow under the line. To disable it set the value of the data-graph-line-shadow attribute to 0.
0
data-graph-line-width
table
width in px
Attribute
Scope
Informations
Allowed values
data-graph-xaxis-end-on-tick
table
Remove margin between the line and the graph end.
1
data-graph-xaxis-labels-enabled
table
Allows to specify if the labels on the X-axis must be enabled and displayed (default) or disabled.
0 / 1
data-graph-xaxis-labels-font-size
table
Allows to specify the font size that should be used for labels on the X-Axis.
Valid CSS size
data-graph-xaxis-max
table
Highcharts detects the maximum values of the X axis, but sometimes it is usefull to force this value.
Decimal
data-graph-xaxis-min
table
Highcharts detects the minimum values of the X axis, but sometimes it is usefull to force this value.
Decimal
data-graph-xaxis-rotation
table
Default : 0
Degres
data-graph-xaxis-start-on-tick
table
Remove margin between the line and Y axis.
1
data-graph-xaxis-title-text
table
Any string
data-graph-xaxis-type
table
Supports only one type : datetime, which displays irregular time data
datetime
data-graph-yaxis-2-opposite
table
Move the second Yaxis to the right. You must use data-graph-yaxis to define which serie is on the second axis.
1
data-graph-yaxis-X-formatter-callback
table
Callback to format the YAxis values. Where x is the number of the axis (generaly data-graph-yaxis-1-formatter-callback)
Name of the function to call
data-graph-yaxis-X-reversed
table
Higher values are closer to the xAxis.
1
data-graph-yaxis-X-stacklabels-enabled
table
Displays total on columns when they are stacked with the data-graph-stack-group attribute.
1
Attribute
Scope
Informations
Allowed values
data-graph-datalabels-align
table
Defines where to put the label according to the point position.
data-graph-datalabels-color
table
th
Change the datalabel color.
Could be defined for all the chart on the table tag or just for one serie on the th tag. The th tag value overrides the table tag value.
Any string
data-graph-datalabels-enabled
table
th
Displays values on each point of the graph.
Could be defined for all the chart on the table tag or just for one serie on the th tag. The th tag value overrides the table tag value.
1 or 0
data-graph-point-callback
table
Name of the function to call, the first parameter is an Highcharts Point object
Attribute
Scope
Informations
Allowed values
data-graph-vline-height
th
Arbitrary draws a vertical line in the graph. Must be used with the data-graph-vline-x attribute.
decimal
data-graph-vline-name
th
Value displayed on the vertical line tooltip.
decimal
data-graph-vline-x
th
Arbitrary draws a vertical line in the graph. Must be used with the data-graph-vline-height attribute.
decimal
Attribute
Scope
Informations
Allowed values
data-graph-item-color
td
hexadecimal color
data-graph-item-highlight
td
Moves the serie outside the chart to be more visible.
1
data-graph-name
th
Sector's name in a pie chart
Any string
The second parameter contains the objet that will be passed to the Highcharts.Chart function. That's the one you must modify in order to change the colors of the graph.
The documentation about this object is available in the Highcharts doc.
$('table.highchart')
  .bind('highchartTable.beforeRender', function(event, highChartConfig) {
    highChartConfig.colors = ['#104C4C', '#88CCCC', '#228E8E', '#CCFFFF', '#00CCCC', '#3399CC'];
  })
  .highchartTable();
  $('table.highchart')
  .bind('highchartTable.beforeRender', function(event, highChartConfig) {
    $.each(highChartConfig.yAxis, function (index, value)   {
      value.title.text = value.title.text || 'Valeur';
    });
  });
 JS Tutorial


