First chart
Next, a few lines Javascript code is needed for your first chart. First, the chart data are prepared, a simple array contains other arrays, each of two elements. Each of these two-element arrays will represent one point in a line graphic, or one bar in a bar chart, or a pie section in a pie chart.
This data is stored in the myData variable as in the following example.
<script type="text/javascript">
	var myData = new Array([10, 20], [15, 10], [20, 30], [25, 10], [30, 5]);
	var myChart = new JSChart('chartcontainer', 'line');
	myChart.setDataArray(myData);
	myChart.draw();
</script>
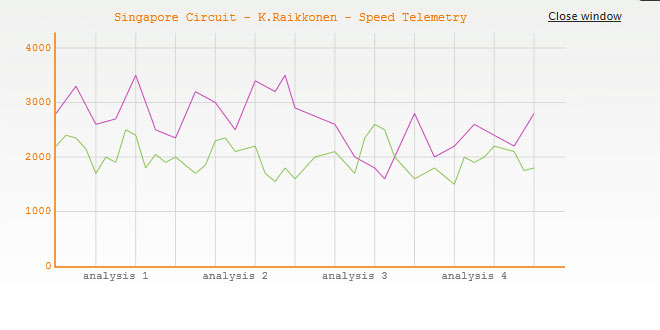
Fig. 1.3 - A simple line chart
Second line initializes the chart by providing the container ID, the chart type (possible values are line, bar and pie).
Third line introduces the data to the JSChart object.
And finally the fourth line executes the chart drawing.
<script type="text/javascript">
	var myData = new Array(['unit', 20], ['unit two', 10], ['unit three', 30], ['other unit', 10], ['last unit', 30]);
	var myChart = new JSChart('chartcontainer', 'bar');
	myChart.setDataArray(myData);
	myChart.draw();
</script>
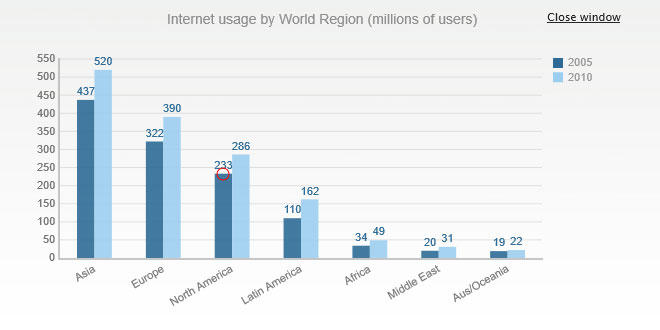
Fig. 1.4 - Bar type chart; observe the data array format
<script type="text/javascript">
	var myChart = new JSChart('chartcontainer', 'bar');
	myChart.setDataXML('data.xml');
	myChart.draw();
</script>
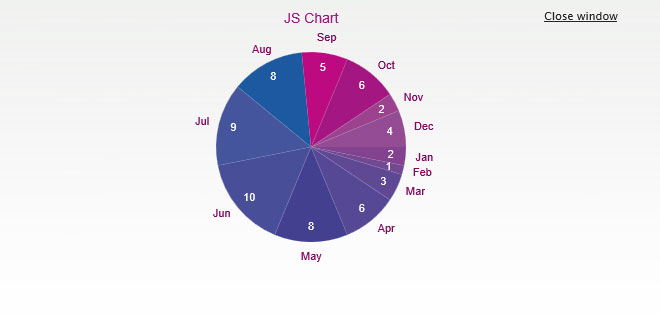
Fig. 1.5 - Pie chart using an XML file for data input
<script type="text/javascript">
	var myChart = new JSChart('chartcontainer', 'pie');
	myChart.setDataJSON('data.json');
	myChart.draw();
</script>
Fig. 1.6 - Pie chart using an XML file for data input
Above are two examples for bar and pie type charts. In the last example, XML and JSON files were used to input the data intro the JSChart object.
The XML and JSON files must have an exact format:
<?xml version="1.0"?>
<JSChart>
	<dataset type="line">
		<data unit="10" value="20"/>
		<data unit="15" value="10"/>
		<data unit="20" value="30"/>
		<data unit="25" value="10"/>
		<data unit="30" value="5"/>
	</dataset>
</JSChart>
Fig. 1.7 - XML file example
{
	"JSChart" : {
		"datasets" : [
			{
				"type" : "pie",
				"data" : [
					{
						"unit" : "Unit_1",
						"value" : "20"
					},
					{
						"unit" : "Unit_2",
						"value" : "10"
					},
					{
						"unit" : "Unit_3",
						"value" : "30"
					},
					{
						"unit" : "Unit_4",
						"value" : "10"
					},
					{
						"unit" : "Unit_5",
						"value" : "5"
					}
				]
			}
		]
	}
}
Fig. 1.8 - JSON file example
The main node must be named JSChart. The child nodes can be dataset, colorset and optionset. In the above example only the dataset is used, since it is the only mandatory child node. The dataset must define the chart type (line in the above example) and must contain all the chart data. The unit and value correspond to the array pair in the previous example. Colorset and optionset are described in the Customization chapter.
Watermark
The JS Charts 3.0 domain keys are simple hash ids generated for a specific domain where the charts will be hosted on.
The JS Charts 3.0 work without these domain keys but they will display a watermark over the charts. By using these domain keys, the watermark will be turned off. To get such a domain key you must purchase a JS Charts 3.0 Domain:
<script type="text/javascript">
	var myData = new Array([10, 20], [15, 10], [20, 30], [25, 10], [30, 5]);
	var myChart = new JSChart('chartcontainer', 'line', 'b4949a117e0bff9be30');
	myChart.setDataArray(myData);
	myChart.draw();
</script>
Fig. 1.9 - Domain key usage
<script type="text/javascript">
	var myData = new Array([10, 20], [15, 10], [20, 30], [25, 10], [30, 5]);
	var myChart = new JSChart('chartcontainer', 'line', 'b4949a117e0bff9be30,bd6b66a2c65ee32a549');
	myChart.setDataArray(myData);
	myChart.draw();
</script>
-
On the JS Charts main site, from the Prices page select one of the domain licenses available and press the Add to cart button.
-
Next, you'll be taken to the JumpeyeComponents.com shopping cart where you'll be able to apply a discount coupon, if you have one. Once the purchase is completed you'll be prompted to go to the Downloads page into your JumpeyeComponents.com account.
-
If you haven't signed into your JumpeyeComponents.com account you'll be prompted to do so. Once you logged in, you will be able to access the JS Charts domains from the My JS Charts domains menu, on the right side of the site.
-
In the My JS Charts domains page you can add an Internet domain where your JS Charts will be hosted and copy the generated hash id for that particular domain.
Multiple domain keys can be typed in the 3rd argument of the JS Charts constructor, separated by commas. This can be useful if you want to use the exact code on multiple domains.
-
Finally upload the chart to the Internet domain for which you retrieved the hash id and the watermark should be turned off from the chart.