User Rating: 3.6/5 ( 8 votes)
Highcharts is a charting library written in pure JavaScript, offering an easy way of adding interactive charts to your web site or web application. Highcharts currently supports line, spline, area, areaspline, column, bar, pie, scatter, angular gauges, arearange, areasplinerange, columnrange, bubble, box plot, error bars, funnel, waterfall and polar chart types.
Features
Compatible
It works in all modern mobile and desktop browsers including the iPhone/iPad and Internet Explorer from version 6. On iOS and Android, multitouch support provides a seamless user experience. Standard browsers use SVG for the graphics rendering. In legacy Internet Explorer graphics are drawn using VML.
Free for Non-commercial
Do you want to use Highcharts for a personal website, a school site or a non-profit organisation? Then you don't need the author's permission, just go on and use Highcharts. For commercial websites and projects, see License and Pricing.
Open
One of the key features of Highcharts is that under any of the licenses, free or not, you are allowed to download the source code and make your own edits. This allows for personal modifications and a great flexibility.
Pure JavaScript
Highcharts is solely based on native browser technologies and doesn't require client side plugins like Flash or Java. Furthermore you don't need to install anything on your server. No PHP or ASP.NET. Highcharts needs only two JS files to run: The highcharts.js core and either the jQuery, MooTools or Prototype framework. One of these frameworks is most likely already in use in your web page.
Numerous Chart Types
Highcharts supports line, spline, area, areaspline, column, bar, pie, scatter, angular gauges, arearange, areasplinerange, columnrange and polar chart types. Many of these can be combined in one chart.
Simple Configuration Syntax
Setting the Highcharts configuration options requires no special programming skills. The options are given in a JavaScript object notation structure, which is basically a set of keys and values connected by colons, separated by commas and grouped by curly brackets.
Dynamic
Through a full API you can add, remove and modify series and points or modify axes at any time after chart creation. Numerous events supply hooks for programming agains the chart. In combination with jQuery, MooTools or Prototype's Ajax API, this opens for solutions like live charts constantly updating with values from the server, user supplied data and more.
Multiple Axes
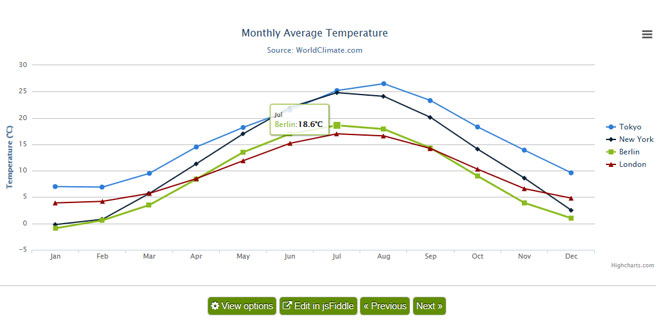
Sometimes you want to compare variables that are not the same scale - for example temperature versus rainfall and air pressure. Highcharts lets you assign an y axis for each series - or an x axis if you want to compare data sets of different categories. Each axis can be placed to the right or left, top or bottom of the chart. All options can be set individually, including reversing, styling and position.
Tooltip Labels
On hovering the chart Highcharts can display a tooltip text with information on each point and series. The tooltip follows as the user moves the mouse over the graph, and great efforts have been taken to make it stick to the nearest point as well as making it easy to read a point that is below another point.
Datetime Axis
75% of all charts with an X and Y axis have a date-time X axis. Therefore Highchart is very intelligent about time values. With milliseconds axis units, Highcharts determines where to place the ticks so that they always mark the start of the month or the week, midnight and midday, the full hour etc.
Export and print
With the exporting module enabled, your users can export the chart to PNG, JPG, PDF or SVG format at the click of a button, or print the chart directly from the web page.
Zooming
By zooming in on a chart you can examine an especially interesting part of the data more closely. Zooming can be in the X or Y dimension, or both.
External Data Loading
Highcharts takes the data in a JavaScript array, which can be defined in the local configuration object, in a separate file or even on a different site. Furthermore, the data can be handled over to Highcharts in any form, and a callback function used to parse the data into an array.
Angular gauges
Ideal for dashboards, angular gauges provides speedometer-like charts, easy to read at a quick glance.
Polar charts
Cartesian chart types like line, area, spline or areaspline can be converted to polar or radial chart by one simple option.
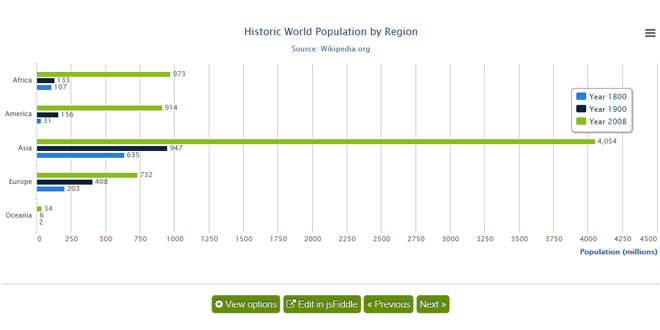
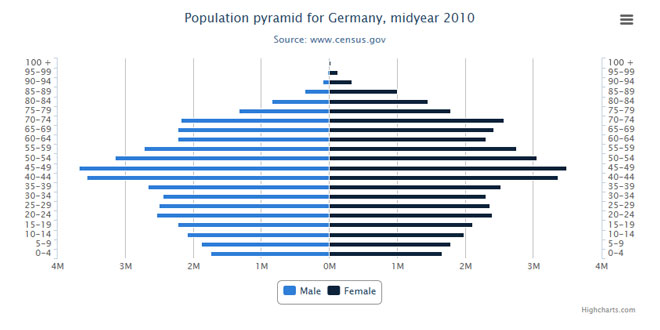
Inverted Chart or Reversed Axis
Sometimes you need to flip over your chart and make the X axis appear vertical, like for example in a bar chart. Reversing the axis, with the highest values appearing closest to origo, is also supported.
Text Rotation for Labels
All text labels, including axis labels, data labels for the point and axis titles, can be rotated in any angle.
Installation
Highcharts requires two files to run, highcharts.js and either jQuery, MooTools or Prototype or our own Highcharts Standalone Framework which are used for some common JavaScript tasks. If you're installing Highstock, the procedure is the same as below, except the JavaScript file name is highstock.js rather than highcharts.js.
A. Include Highcharts and framework
Include the JavaScript files in the <head> section of your web page as shown below.
Option #1: use jQuery
Use this code to include Highcharts with jQuery:
<script src="http://ajax.googleapis.com/ajax/libs/jquery/1.8.2/jquery.min.js"></script>
<script src="http://code.highcharts.com/highcharts.js"></script>
Option #2: use Highcharts Standalone Framework
jQuery is currently used in most websites, but there may be situations where you don't want to load the full framework in order to utilize Highcharts. For this we have built the Highcharts Standalone Framework, a compact file of 2 kB gzipped. It is available since Highcharts 3.0.5. Use this code to load the Standalone Framework from our CDN:
<script src="http://code.highcharts.com/adapters/standalone-framework.js"></script>
Option #3: Use MooTools or Prototype
While the jQuery adapter is built into Highcharts and Highstock, the MooTools and Prototype adapter has to be included separately. Use this code to include Highcharts with MooTools:
<script src="https://ajax.googleapis.com/ajax/libs/mootools/1.4.5/mootools-yui-compressed.js"></script>
<script src="http://code.highcharts.com/adapters/mootools-adapter.js"></script>
<script src="http://code.highcharts.com/highcharts.js"></script>
and use this code to include Highcharts with Prototype:
<script src="https://ajax.googleapis.com/ajax/libs/prototype/1.7/prototype.js"></script>
<script src="http://code.highcharts.com/adapters/prototype-adapter.js"></script>
<script src="http://code.highcharts.com/highcharts.js"></script>
Note: If MooTools or Prototype is used they need to be included before highcharts.js, this is because highcharts.js checks to see if MooTools or Prototype are present.
B. Alternatively, load files from your own domain
In the example above the JavaScript files are loaded from ajax.googleapis.com and code.highcharts.com. The Highcharts files can be downloaded from highcharts.com and put on your webpage. Here is an example with jQuery and highcharts served from your own server:
<script src="/js/jquery.min.js"></script>
<script src="/js/highcharts.js"></script>
C. Get started
We will start off by creating a simple bar chart.
-
Add a div in your webpage. Give it an id and set a specific width and height which will be the width and height of your chart.
<div id="container" style="width:100%; height:400px;"></div>
-
A chart is initialized by adding the JavaScript tag, <script> </script>, anywhere in a webpage, containing the following code for jQuery. The div from #1 is referenced in the jQuery object.
$(function () {
    $('#container').highcharts({
        chart: {
            type: 'bar'
        },
        title: {
            text: 'Fruit Consumption'
        },
        xAxis: {
            categories: ['Apples', 'Bananas', 'Oranges']
        },
        yAxis: {
            title: {
                text: 'Fruit eaten'
            }
        },
        series: [{
            name: 'Jane',
            data: [1, 0, 4]
        }, {
            name: 'John',
            data: [5, 7, 3]
        }]
    });
});
The code above uses the jQuery specific way of launching code on document ready, as explained at the jQuery website. If you use MooTools or Prototype, instead of the $(function () syntax you do it slightly differently. Also, Highcharts isn't registered as a plugin in these frameworks, so you need to use the Highcharts.Chart constructor and define the chart.renderTo option.
MooTools
window.addEvent('domready', function() {
   var chart1 = new Highcharts.Chart({
      chart: {
         renderTo: 'container',
         type: 'bar'
   ...
});
Prototype
document.observe("dom:loaded", function() {
   var chart1 = new Highcharts.Chart({
      chart: {
         renderTo: 'container',
         type: 'bar'
   ...
});
If you are inserting a Stock chart, there is a separate constructor method called Highcharts.StockChart. In these charts, typically the data is supplied in a separate JavaScript array, either taken from a separate JavaScript file or by an Ajax call to the server.
var chart1; // globally available
$(function() {
      chart1 = new Highcharts.StockChart({
         chart: {
            renderTo: 'container'
         },
         rangeSelector: {
            selected: 1
         },
         series: [{
            name: 'USD to EUR',
            data: usdtoeur // predefined JavaScript array
         }]
      });
   });
-
You should now see this chart on your webpage:

-
Optionally, you can apply a global theme to your charts. A theme is just a set of options that are applied globally through the Highcharts.setOptions method. The download package comes with four predefined themes. To apply a theme from one of these files, add this directly after the highcharts.js file inclusion:
<script type="text/javascript" src="/js/themes/gray.js"></script>
How to set options
Highcharts use a JavaScript object structure to define the options or settings of a chart. This article explains how the options object works and how to use it.
The options object
When you initialize the chart using its constructor Highcharts.Chart, the options object is the first parameter you pass.
In the example below the code marked as red represents the options object:
$(document).ready(function() {
    var chart1 = new Highcharts.Chart({
        chart: {
            renderTo: 'container',
            type: 'bar'
        },
        title: {
            text: 'Fruit Consumption'
        },
        xAxis: {
            categories: ['Apples', 'Bananas', 'Oranges']
        },
        yAxis: {
            title: {
                text: 'Fruit eaten'
            }
        },
        series: [{
            name: 'Jane',
            data: [1, 0, 4]
        }, {
            name: 'John',
            data: [5, 7, 3]
        }]
    });
});
To get the most out of Highcharts, it is important to understand how the options object works and how it can be altered programmatically. These are some key concepts on JavaScript objects:
-
The Highcharts options in the examples are defined as object literals. By notating the configuration this way, we can have a clean, human readable and low space consuming config object. The following complicated code is perhaps more familiar to developers with a background from C-type languages:
// Bad code:
var options = new Object();

options.chart = new Object();
options.chart.renderTo = 'container';
options.chart.type = 'bar';

options.series = new Array();
options.series[0] = new Object();
options.series[0].name = 'Jane';
options.series[0].data = new Array(1, 0, 4);
As JavaScript object literals, we would write it like below. Note that the two options objects will produce exactly the same result.
// Good code:
var options = {
    chart: {
        renderTo: 'container',
        type: 'bar'
    },
    series: [{
        name: 'Jane',
        data: [1, 0, 4]
    }]
};
In the example above the options object is created by itself and can be added to the chart by passing it to the chart constructor:
$(document).ready(function() {
    var chart = new Highcharts.Chart(options);
});
-
After an object is created using the object literal notation, we can extend its members by the dot notation. Say we have an object like defined in the "Good code" above. The code below adds another series to it. Remember options.series is an array, so it has a push method.
options.series.push({
    name: 'John',
    data: [3, 4, 2]
})
-
Another fact that can come in handy when working on JavaScript objects, is that the dot notation and square bracket notation are equivalent, so you can access all members by their string names. Which in practice means that
options.renderTo
is always the same as:
options['renderTo']
Global Options
If you want to apply a set of options to all charts on the same page, use Highcharts.setOptions like shown below.
$(function() {
    Highcharts.setOptions({
        chart: {
            backgroundColor: {
                linearGradient: [0, 0, 500, 500],
                stops: [
                    [0, 'rgb(255, 255, 255)'],
                    [1, 'rgb(240, 240, 255)']
                    ]
            },
            borderWidth: 2,
            plotBackgroundColor: 'rgba(255, 255, 255, .9)',
            plotShadow: true,
            plotBorderWidth: 1
        }
    });

    var chart1 = new Highcharts.Chart({
        chart: {
            renderTo: 'container',
        },

        xAxis: {
            type: 'datetime'
        },

        series: [{
            data: [29.9, 71.5, 106.4, 129.2, 144.0, 176.0, 135.6, 148.5, 216.4, 194.1, 95.6, 54.4],
            pointStart: Date.UTC(2010, 0, 1),
            pointInterval: 3600 * 1000 // one hour
        }]
    });

    var chart2 = new Highcharts.Chart({
        chart: {
            renderTo: 'container2',
            type: 'column'
        },

        xAxis: {
            type: 'datetime'
        },

        series: [{
            data: [29.9, 71.5, 106.4, 129.2, 144.0, 176.0, 135.6, 148.5, 216.4, 194.1, 95.6, 54.4],
            pointStart: Date.UTC(2010, 0, 1),
            pointInterval: 3600 * 1000 // one hour
        }]
    });
});
More infomation at: http://www.highcharts.com/docs