Download
User Rating: 4.5/5 ( 2 votes)
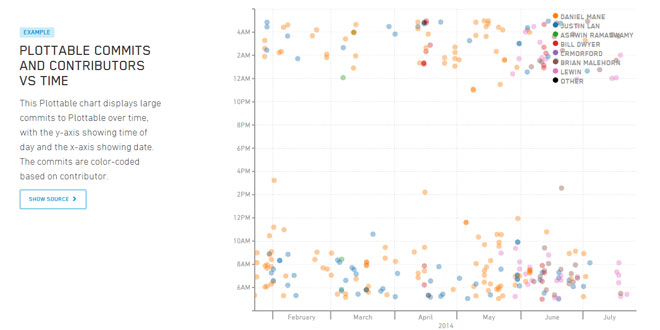
Plottable.js is a library for easily creating flexible, interactive, and performant charts for the web. It is built on top of D3 and provides higher-level pieces, like plots, gridlines, and axes. As such, it's easier to quickly build charts
Plottable consists of three main pieces:
-
A grid-based layout engine which handles positioning, sizing, and alignment of components
-
"Components", such as LinePlot or Axis, which process data and can be connected to d3 Scales
-
"Interactions", such as PanZoomInteraction or AreaInteraction, which easily allow for custom logic to be bound to common interaction patterns
By virtue of being higher-level than D3, it is often much easier to create charts in Plottable.js, with less of a learning curve. Plottable's Plots provide a convenient API for encapsulating, sharing and reusing D3 visualizations.
Source: palantir.github.io
1. INCLUDE CSS AND JS FILES
<link rel="stylesheet" type="text/css" href="../plottable.css" />

<script src="http://d3js.org/d3.v3.min.js" charset="utf-8"></script>
<script src="../plottable.js"></script>
2. HTML
<svg id="basicChart" width="640" height="480"/>
3. JAVASCRIPT
var xyData = [
  {"x": 0, "y": 1},
  {"x": 0.11865740740740742, "y": 2},
  {"x": 0.11887731481481482, "y": 3},
  {"x": 1.1845949074074074, "y": 4},
  {"x": 1.2361342592592592, "y": 5},
  {"x": 1.2718402777777778, "y": 6},
  {"x": 4.949074074074074, "y": 7},
  {"x": 4.975763888888889, "y": 8},
  {"x": 4.981296296296296, "y": 9},
  {"x": 4.984826388888888, "y": 10},
  {"x": 4.989039351851852, "y": 11},
  {"x": 4.989537037037037, "y": 12},
  {"x": 4.990486111111111, "y": 13},
  {"x": 5.005173611111111, "y": 14}
  ...
];
function makeBasicChart() {
  // These scales are Plottable wrappers for a d3.scale object.
  // Like D3 scales, they manage a mapping from data to visual properties; pixel positions in this case
  // Unlike D3 scales, they automatically set their domain and range, and have event handling to update dependent components on changes
  var xScale = new Plottable.Scale.Linear();
  var yScale = new Plottable.Scale.Linear();

  // The Axes and LinePlot are all Components, meaning they take up visual space and are placed by the layout engine
  var xAxis = new Plottable.Axis.Numeric(xScale, "bottom");
  var yAxis = new Plottable.Axis.Numeric(yScale, "left");
  var renderer = new Plottable.Plot.Line(xyData, xScale, yScale);


  // Now we'll make a Table to organize the layout of the components. The first row will have a yAxis and renderer; the second will
  // only have the xAxis, and it will be aligned to the column of the renderer.
  // The yAxis is fixed-width and the xAxis is fixed-height, so the renderer will naturally expand to take up all free space
  var chart = new Plottable.Component.Table([
                    [yAxis, renderer],
                    [null,  xAxis   ]
                  ]);

  chart.renderTo("#basicChart");
}
window.onload = makeBasicChart;
More information at http://palantir.github.io/plottable/tutorials/
 JS Tutorial


